How to Adjust an Iron Butterfly (and why the body stays locked)
An iron butterfly can breach its breakeven, sit at a fifty dollar loss for three weeks, and then hit maximum loss without the stock moving again. Here is the priced AMD example, and why you cannot manage this trade by watching your P&L.
The iron butterfly has a peculiar property that almost no article about it mentions, and it is the reason people get hurt by them.
The position can blow through its breakeven, sit there for three weeks looking like a fifty dollar problem, and then arrive at maximum loss without the stock ever moving again. The damage is real from the moment the breakeven is crossed. You just cannot see it on your screen yet, because the enormous theta on the short body is holding the mark-to-market up like a jack under a car. When the jack comes out, it comes out all at once.
This article is about that, and about what it means for when you adjust.
The numbers, priced
AMD is at $170. You sell the $170 put and the $170 call, both at the money, and buy the $155 put and the $185 call as protection. Wings are $15 wide, 35 days out, implied vol around 45%, which is ordinary for the name.
| Leg | Price |
|---|---|
| Sell $170 call | +$9.79 |
| Sell $170 put | +$9.06 |
| Buy $155 put | −$3.25 |
| Buy $185 call | −$4.32 |
| Net credit | +$11.28 ($1,128) |
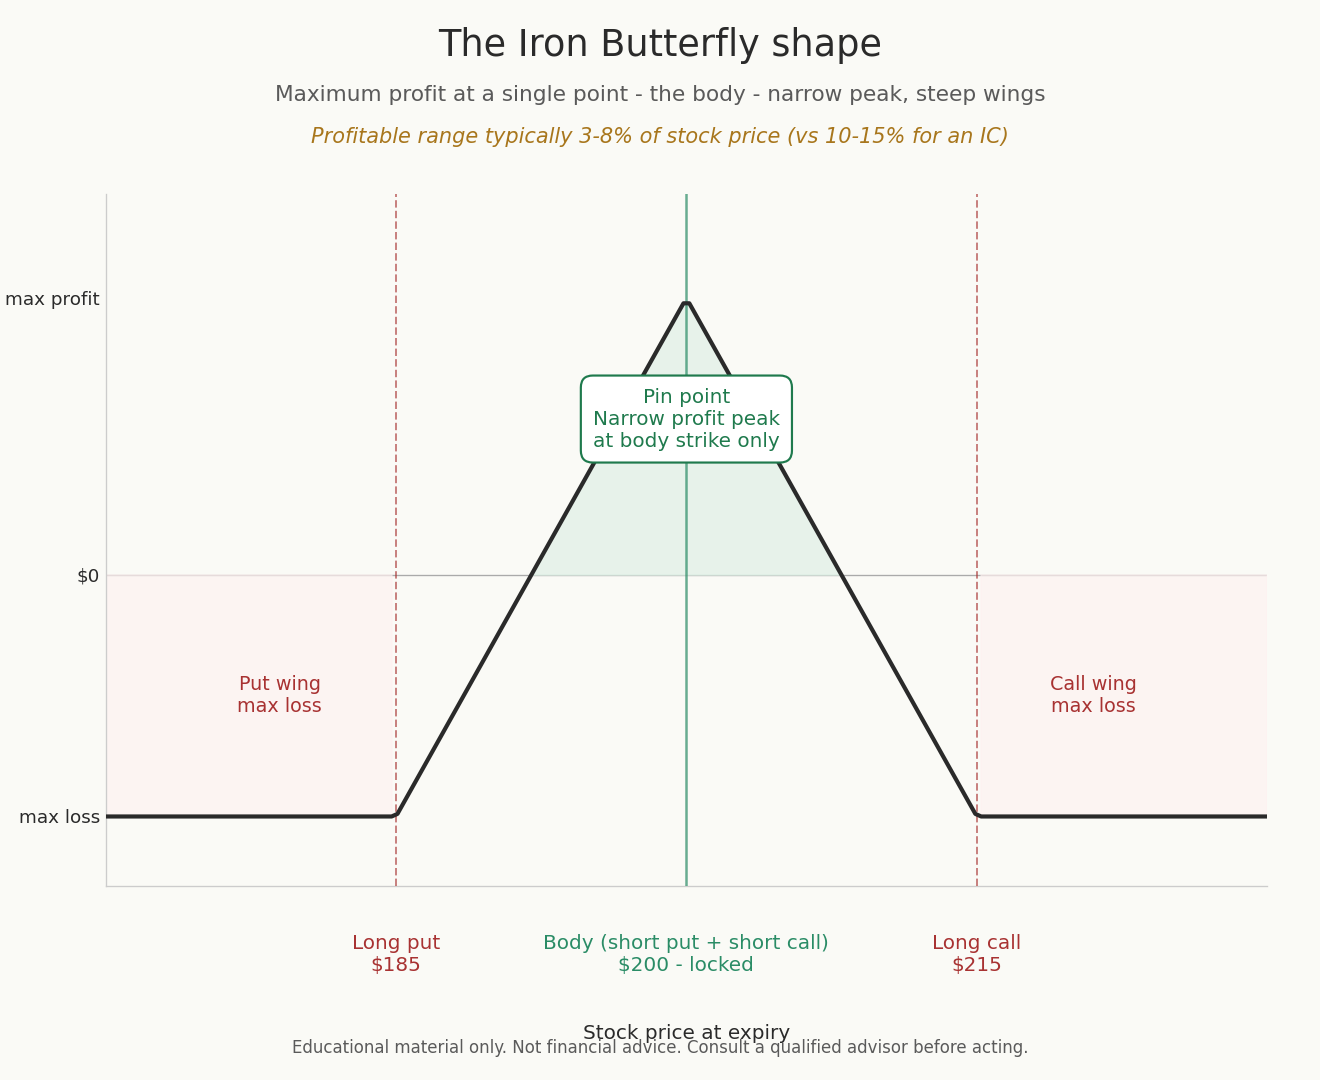
Max profit is the credit, $1,128, if AMD pins exactly at $170. Max loss is the wing width minus the credit, ($15.00 − $11.28) × 100, which is $372.
That looks like a spectacular trade. Risk $372 to make $1,128. Now look at the breakevens, which are the strike plus and minus the credit: $158.72 and $181.28.
That is a band of plus or minus 6.6% on a semiconductor stock, over five weeks. AMD does that in a fortnight without trying. The favourable risk-reward is not a gift, it is the price of a very narrow target, and the market has priced it correctly.
The part that gets people
AMD reports a strong quarter and runs to $188. That is 10.6% up, comfortably past your $181.28 upper breakeven. There are 23 days left.
You check the position. It is down $58.
Fifty-eight dollars. On a trade with a $372 maximum loss and a $1,128 maximum gain. The stock has left your profitable range entirely and the screen is showing you a rounding error. So you leave it alone, because it looks fine, and because the theta on this thing is enormous and surely that will pull it back.
Here is what happens over the following three weeks if AMD does not move again. Not one cent. It just sits at $188.
| Days to expiry | Cost to close | Mark-to-market |
|---|---|---|
| 23 | $11.87 | −$58 |
| 18 | $11.78 | −$50 |
| 14 | $11.76 | −$48 |
| 10 | $11.86 | −$58 |
| 7 | $12.11 | −$83 |
| 4 | $12.75 | −$147 |
| 2 | $13.61 | −$233 |
| 0 | $15.00 | −$372 (maximum) |
The stock did not move. Not once. The position went from down $48 to down the entire maximum, and every input except the calendar was frozen.
Your loss was determined the moment AMD closed above $181.28. Everything after that was the market slowly admitting it. The mark-to-market was not telling you the position was fine. It was telling you there was still time value in the legs, which is a completely different statement, and which stops being true.
This is why iron butterflies get managed earlier and tighter than iron condors, and it is not because they are riskier in any theoretical sense. It is because their mark-to-market lies to you for longer. A condor tests a strike and the number on your screen starts screaming. A butterfly breaches its breakeven and the number on your screen shrugs.
So when do you act?
Not on the mark-to-market. It is the wrong instrument. Use these instead.
The breakeven, as a hard line
You know both breakevens at the moment you open the trade. Write them down. If the underlying closes outside that band, the trade has failed, regardless of what your platform says the position is worth today. Everything after that point is a question of how much of the loss you accept, not whether there is one.
The short leg's delta
You opened with both short legs at roughly 0.50, netting to zero. Delta on the tested side climbing past 0.65 means the market now expects that side to finish in the money. Past 0.75, it is pricing near certainty. In the AMD case, the short call hit 0.81 delta while the position still showed a $58 loss.
Time remaining
Inside 14 days with the stock outside the band, there is no adjustment worth making. The theta cushion has already been consumed and any roll is now priced at close to full damage. This is the point at which the only question left is whether you take a $150 loss today or a $372 one on Friday.
The honest menu of adjustments
Assume you catch it early, at the moment the breakeven goes, with three weeks left.
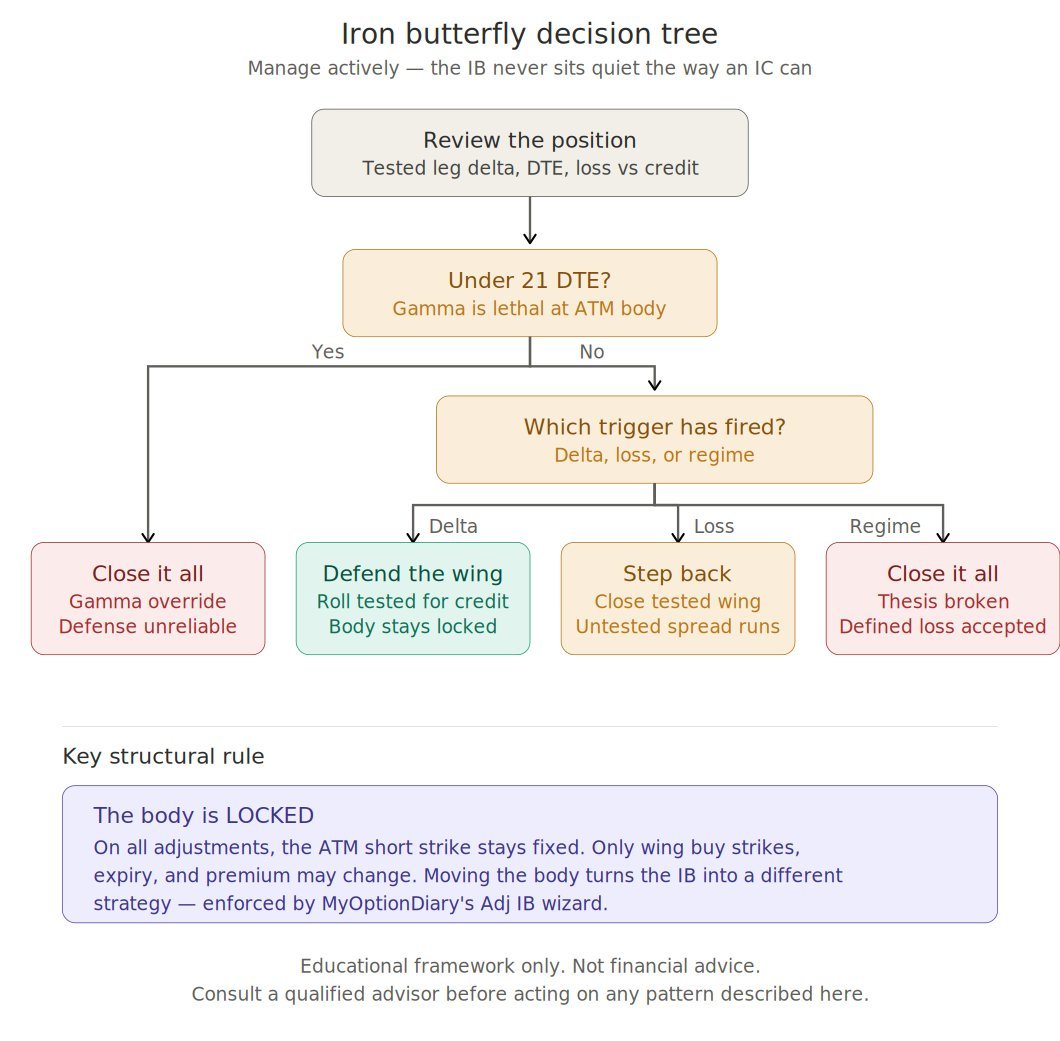
Roll the tested wing out in time. You buy back the short $170 call, sell it again in a later cycle, and move the long $185 call with it. This collects a credit and buys you room. It also extends your exposure to a stock that has just demonstrated it can move 10% in a week, and does nothing to move your breakeven closer to where the stock actually is. It defers.
Close the tested wing, keep the untested one. Buy back the call side, leave the put side to decay. You have converted a butterfly into a bull put spread and realized a loss on the call wing. The remaining position is now aligned with the direction the stock is actually going, which is worth something.
Widen the tested wing. Sell the $185 long call and buy a further-out one. This increases your maximum loss in exchange for a small credit, on the side that is currently losing. Read that sentence again before you do it.
Close. Take the loss while it is a fraction of the maximum. In the AMD case, closing at 23 DTE costs you $58 against a $372 maximum. That is 16% of the possible damage, and the trade thesis, which was that AMD would pin at $170, is already dead. You are not cutting a winner short. You are declining to fund a loser to term.
Whatever you do, the two short strikes at $170 stay where they are. Move them and you no longer have an iron butterfly, you have a condor with wide wings and a different risk profile, opened at a worse price, in the middle of a losing trade. If the body needs to move, the honest description is that you want a different position, and the clean way to get one is to close this and open that.
The Greeks, briefly
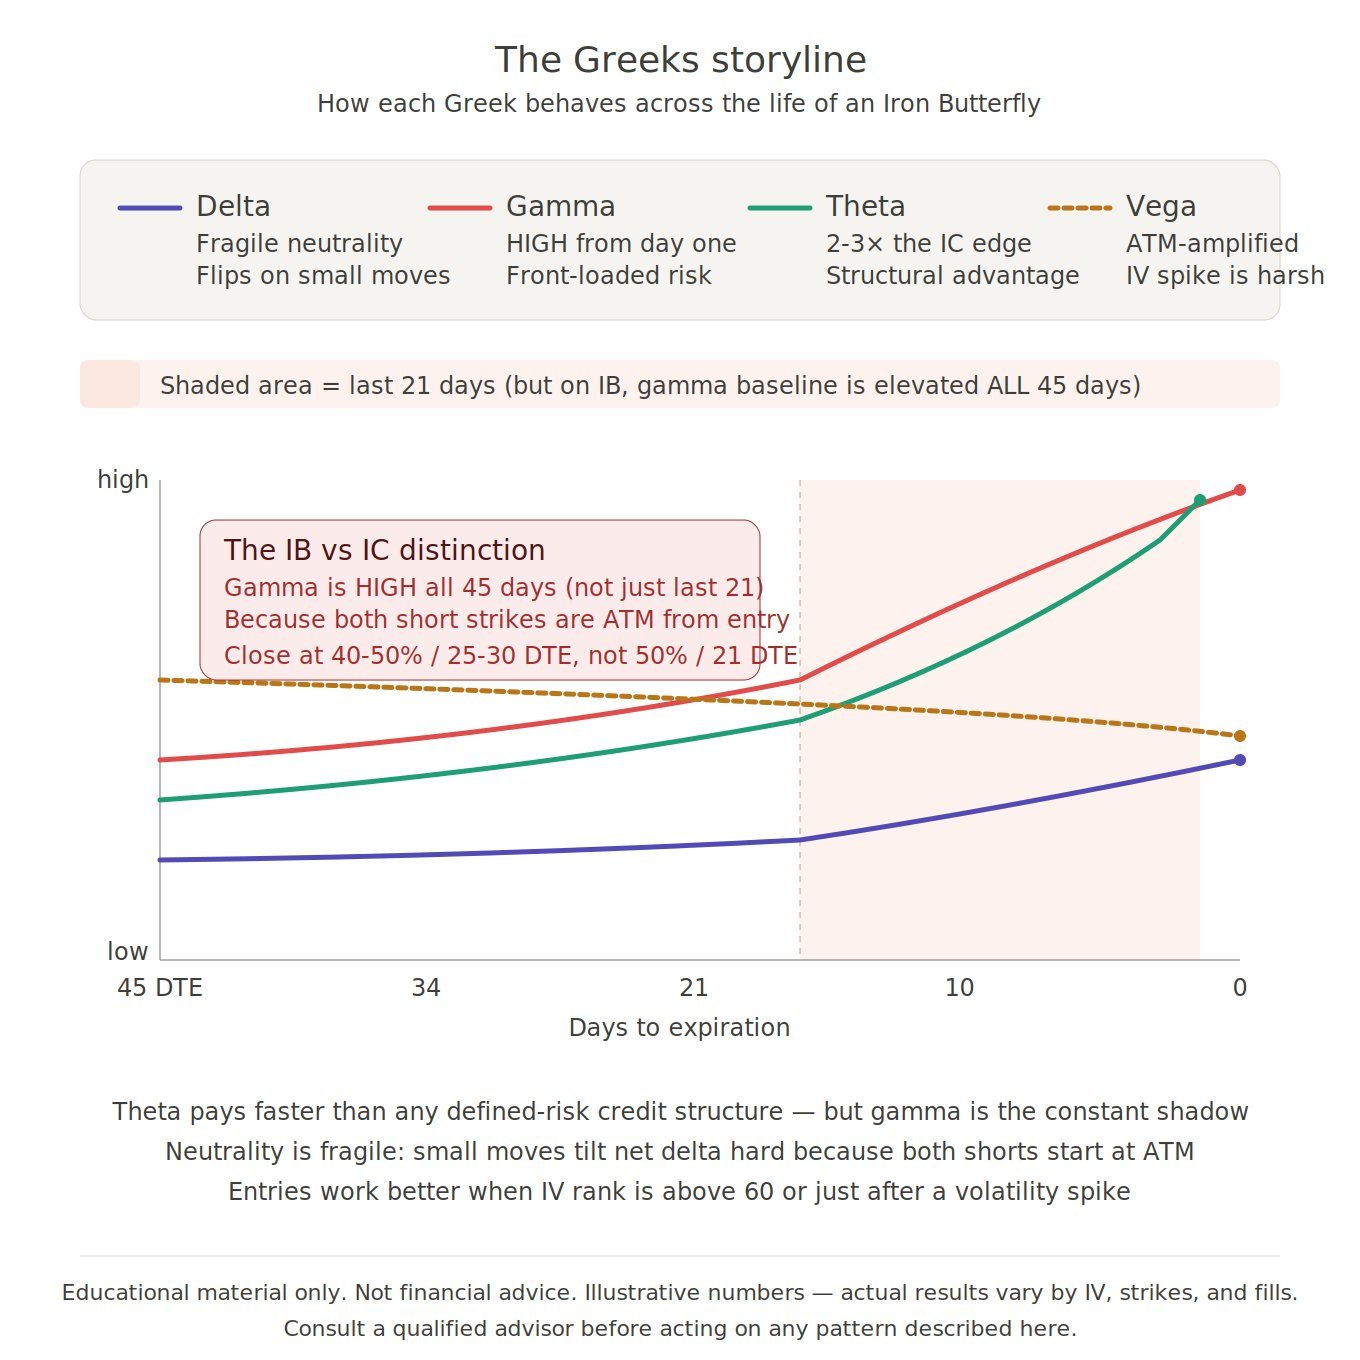
Theta is enormous, because you are short two at-the-money options, which are the most expensive things on the chain in time-value terms. This is the whole appeal. It is also the anaesthetic that stops you noticing the delta damage until it is too late.
Gamma is elevated from the first day, not just near expiry. On a condor, your short strikes start far from the money and gamma is small for weeks. On a butterfly they start at the money, where gamma lives. There is no quiet period.
Vega is short and amplified, for the same reason. At-the-money options carry the most vega on the chain, and you are short two of them. A vol spike hurts a butterfly harder than it hurts a condor with identical wing widths.
The short version
An iron butterfly pays extremely well if a stock finishes at one exact price, and pays nothing if it finishes even moderately away from it. The generous credit is not a bargain. It is the market paying you fairly for accepting a very small target.
The dangerous part is that when the trade goes wrong, your screen will not tell you for weeks. The position sits there looking like a small loss because there is still time value in the options you sold. Then the time value runs out and the small loss becomes the full one, without the stock doing anything at all.
So do not manage this trade by watching your profit and loss. Manage it by writing down your two breakeven prices on the day you open it, and treating them as the alarm.
The decision, as a chart
If you read nothing else
The iron butterfly's risk-reward looks generous because the target is narrow, and the market has priced that correctly. Know your two breakevens before you open the trade and treat them as the alarm, because your mark-to-market will not sound one. A butterfly that has breached its breakeven is already at its maximum loss. The only thing still in question is how much of it you choose to pay.
Iron Butterflies with the body locked on every adjustment
MyOptionDiary supports the full Iron Butterfly adjustment chain through the Adj IB wizard — roll the tested wing, widen, reduce size, close the tested wing, close the position. The ATM body is locked on every adjustment so the structure stays an IB rather than quietly drifting into a different strategy. Each adjustment is recorded as part of the trade chain, with net credit/debit, max profit, max loss per wing, and remaining open legs tracked automatically. The 21 DTE gamma window and tested-leg delta are surfaced as alerts before the trade enters the danger zone. The decisions in this article are the same. The math is just already on the screen.
MyOptionDiary is a trade recording journal — a personal record-keeping and educational tool. It is not a trading advisory, broker, financial advisor, or investment platform, and does not provide any form of financial advice or trading recommendations.
This guide describes adjustment scenarios and patterns drawn from active options trading. Every position, account, and market condition is different; no single approach is universally correct. Outcomes described in worked examples are illustrative — actual results will vary.
Before making any adjustment to a live position, consider your own risk tolerance, capital, and tax situation, and consult a qualified financial advisor if you are uncertain. To the maximum extent permitted by law, MyOptionDiary and its author shall not be liable for any trading losses, financial losses, missed opportunities, tax consequences, or any direct, indirect, incidental, or consequential damages arising from your use of this guide. You are solely responsible for your own trading decisions and their outcomes.